Charting your basal body temperature (BBT) is a quiet, intimate science. It’s a way of listening to the subtle rhythms of your body, gathering clues about ovulation and your fertile window. When done consistently and correctly, it can be an empowering tool. But small, easily overlooked mistakes can cloud the data, leaving you with a confusing chart instead of a clear picture. Let’s walk through the common pitfalls so you can chart with confidence.
What is your basal body temperature telling you?
Before we look at the mistakes, it helps to understand the signal you’re trying to capture. Your basal body temperature is your body’s temperature at complete rest. After ovulation, the hormone progesterone causes a slight but measurable rise in this resting temperature—typically between 0.4 and 1.0 degrees Fahrenheit. By tracking this shift over a cycle, you can confirm that ovulation has occurred. The pattern, not a single temperature, is what matters. A sustained thermal shift indicates your post-ovulatory phase has begun.
The most common BBT charting mistakes
These errors often creep in through inconsistency or misunderstanding the method’s requirements. Being aware of them is the first step to cleaner, more reliable data.
Inconsistent timing and conditions
This is the cornerstone of accurate BBT tracking. Your temperature must be taken at the same time each morning, before any activity. Even sitting up in bed, talking, or getting up to use the bathroom can raise your temperature enough to skew the reading.
Set an alarm for the same time every day, even on weekends. Keep your thermometer on your nightstand.
Similarly, you need a solid block of sleep—at least three consecutive hours, though four or more is ideal—before taking your temperature. A night of broken sleep, illness, or alcohol consumption the night before can disrupt your reading. It’s okay to note these factors on your chart; they provide context for any outliers.
Using the wrong thermometer
A standard fever thermometer isn’t sensitive enough for BBT tracking. You need a basal body thermometer, which measures to one-hundredth of a degree (e.g., 97.65°F). This precision is necessary to detect the subtle shift that indicates ovulation. Digital BBT thermometers are widely available and often come with memory functions or sync with apps, making them a practical choice.
Changing measurement methods mid-cycle
Decide how you will take your temperature—orally, vaginally, or rectally—and stick with that method for the entire cycle. Switching can introduce variance, as these sites can have slightly different baseline readings. Oral is most common, but vaginal or rectal readings can be more consistent for some, as they are less affected by mouth breathing or environmental factors.
Over-interpreting single temperatures
Focusing on a single high or low temperature is a recipe for anxiety. BBT charting is about the overall pattern and trend. One erratic temperature is an outlier; a series of higher temperatures following a series of lower ones is a pattern. Wait to see at least three consecutive temperatures higher than the previous six to confirm the thermal shift.
Starting mid-cycle or stopping too early
To establish your personal baseline and clearly see the shift, you need to chart from the first day of your cycle (the first day of your period) straight through until the next period begins. Starting after you think you’ve ovulated or stopping once you see a shift means you’re missing the full picture, which is crucial for understanding your unique cycle length and luteal phase.
How to chart your BBT correctly
Now for the positive framework. A good routine eliminates guesswork and builds a reliable dataset over time.
- Prepare the night before: Place your BBT thermometer within easy reach of your bed.
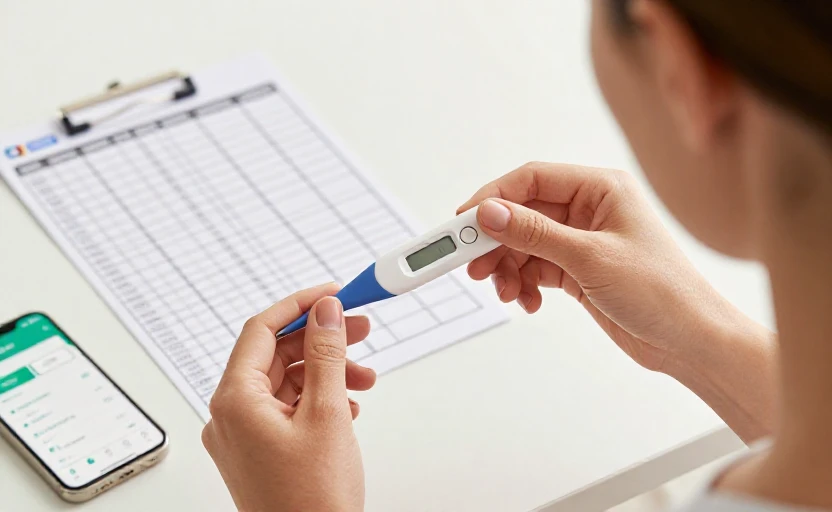
- Measure immediately upon waking: Before you sit up, check your phone, or take a sip of water, take your temperature. If you’re measuring orally, ensure the thermometer is placed under your tongue toward the back.
- Record it right away: Log the temperature immediately in your chosen app or chart. Don’t rely on memory.
- Note relevant factors: Most charting tools allow you to note sleep disturbances, illness, stress, or alcohol use. This context helps you understand anomalies.
- Be patient for the pattern: It often takes two to three full cycles of consistent charting to recognize your personal pattern and predict ovulation with more confidence.
What BBT can and cannot tell you
BBT charting is a powerful confirmatory tool, but it has limits. It confirms ovulation after it has happened by showing the progesterone-driven temperature rise. It does not predict when ovulation will occur in the current cycle. For predicting your fertile window ahead of ovulation, you’ll want to pair BBT with other methods, like tracking cervical mucus changes or using ovulation predictor kits (OPKs).
Your chart can also reveal potential issues, such as a short luteal phase (the time between ovulation and your period) or anovulatory cycles (cycles where no temperature shift occurs, suggesting ovulation didn’t happen). This information can be valuable to share with a healthcare provider if you have concerns about your cycle.
Approach BBT charting as a gentle practice of self-observation, not a high-stakes test. Some cycles will have perfect charts; others will be messy due to life’s interruptions. The goal is consistency over perfection. By avoiding these common mistakes, you’ll gather meaningful data that brings you closer to understanding your body’s unique rhythm.